This is a introductory and a quick node.js debugging tutorial. Node Inspector is a debugger interface for Node.js applications supported by StrongLoop. Let’s start
First, install node inspector globally
$ sudo npm install -g node-inspector
Open the node-inspector first. It will run on background
$ node-inspector
Open another terminal and write
$ node --debug your-app.js
Open chrome and browse > http://127.0.0.1:8080/?ws=127.0.0.1:8080&port=5858
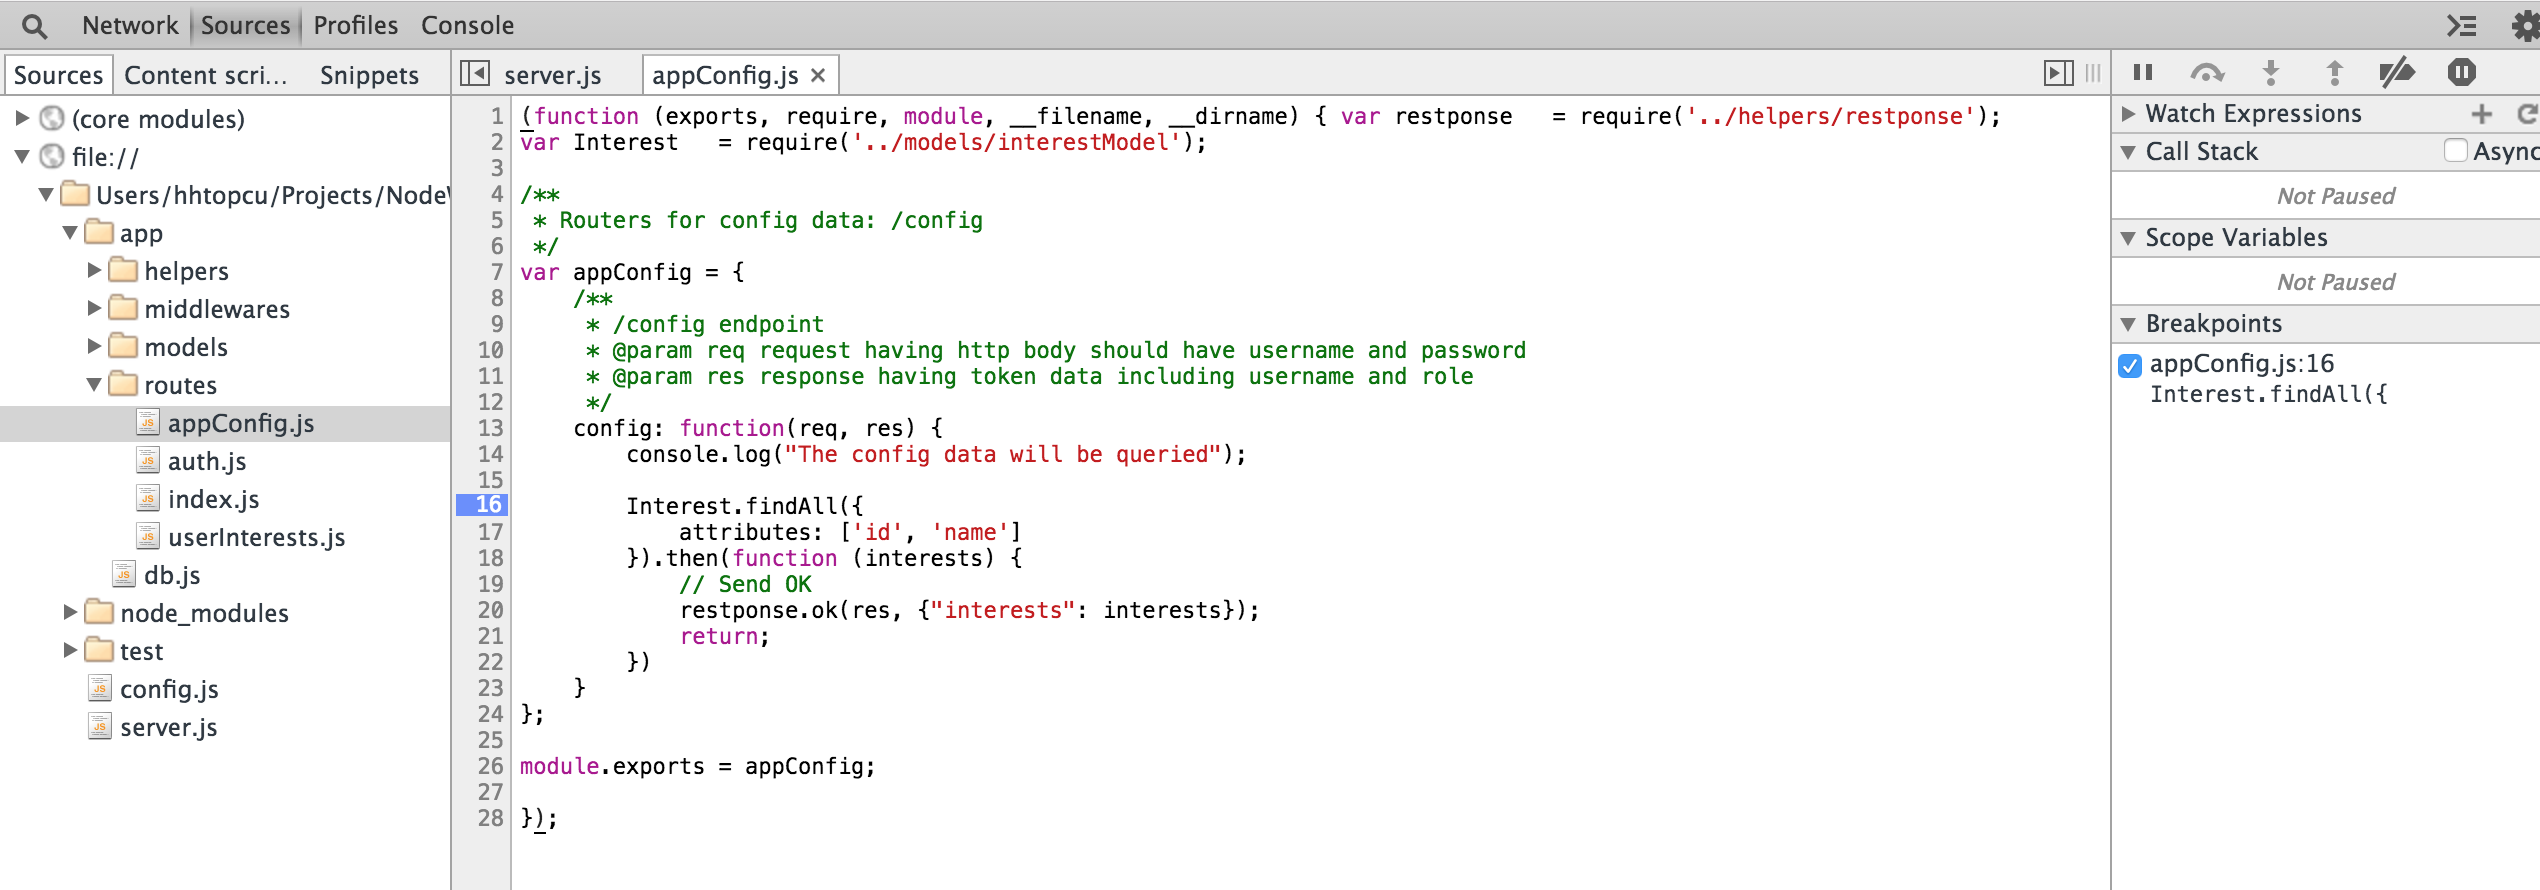
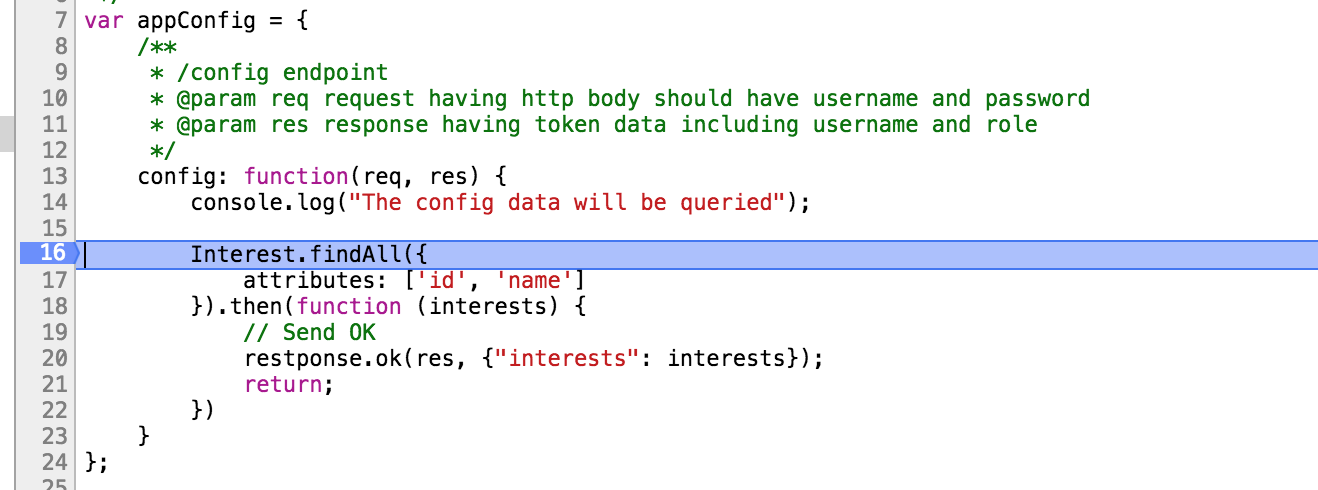
Step over, step into, watch variables and many debugging options exist. Let’s fist put a breakpoint to debug the incoming request
Now, send a GET request to our express powered API using curl to the /config endpoint
$ curl http://localhost:8080/config
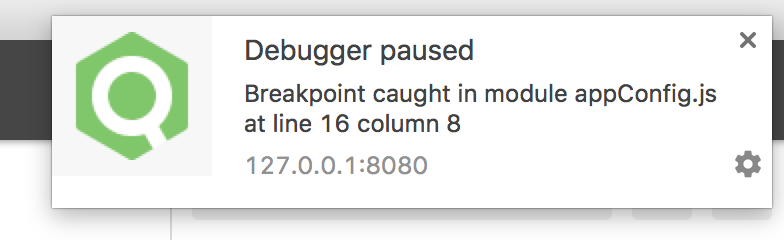
Gotcha, the request hits the breakpoint.
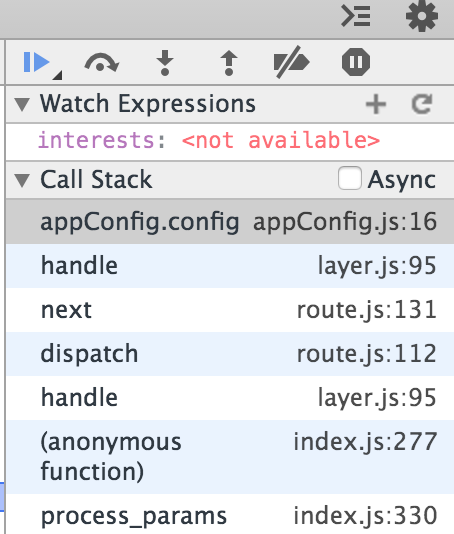
We can watch variables, observe call stack, and many options